Deep learning about your DG&S users from just a bit of given information
When you sell a digital product — online subscriptions, game codes, eBooks, gift cards, digital currencies — you can expect to be favorited on the fraudsters’ playlist.
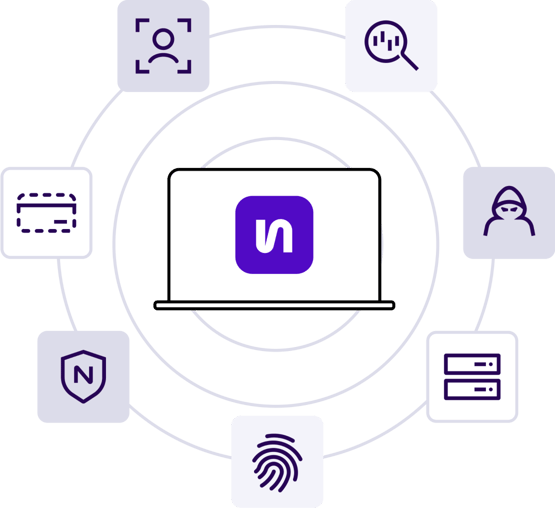
The solution: 4 Pillar Protection (Profiler, ML, API, & human experts)
Less friction, more security, more revenue
The basic checkout form is the common way to complete an online transaction. But forms cause friction and are often a reason for cart abandonment. Shortening the form as much as possible is required to keep conversions — we make that possible!Gathering clues in an instant
Nethone Profiler gathers 5,000+ attributes about every customer to see if they are attempting to anonymize their actions, conceal their true location, or use automation tools to deceive your business. Profiler also observes raw behaviour associated with keystrokes, mouse and accelerometer to inform you whether your customer is real or a fraudster.Merging contexts and quick adaptation
Reviewing 5,000 attributes about every user in real time is impossible for a human, but it’s perfectly suited for a Machine Learning model. ML releases the full data potential by merging contexts, automates decision making by providing actionable recommendations in plain language to your risk team, and adapts to constant changes in user traffic and fraud methods.Minimize false positives
If you are still using basic heuristics and manual rules sets, you’ve taken an important first step. Heuristics can be effective in the short term, but they generate false positives over the long term. Since fraud changes all the time, it’s necessary to use decisioning techniques which adapt quickly.- What Nethone has learned about online fraud over the years and what Profiler is seeing in real time;
- Fraud attempts that your company has already encountered;
- External data sources from 3rd party partners who specialize in online fraud.
Personalized Machine Learning
Our clients are assigned a dedicated Data Scientist who understands your KPIs and shares actionable insights about your business.Our Data Scientist provides personalised service, so that you are never stuck waiting for Customer Support.
The power of partnership
Our Data Scientist cooperates with your risk analysts to find new fraud patterns affecting your business. Machine Learning models will be tuned to respond to new patterns of activity.Panel - the way we visualize all of these data
Our panel also has a state of the art case manager for your fraud team. They can use it to automate their day-to-day activities to gain more time and information to tackle the most challenging cases that fall into manual reviews.
Dashboard
Aggregated traffic characteristics in a specified time frame
Let’s say you want to determine the traffic on your website in the context of fraud and payments.
The panel is the start of a comprehensive view of user profiles, visualization of data, and tracking of ML decisions based on signals and connections.
Profiling
User’s activity session within the platform
In the Profiling Details view, you can see all the user’s activity (e.g. creating account or adding product to the cart) within one session. All their actions are gathered in a consecutive order on a timeline which we refer to as profiling. On top of that, in this view we provide a summary of the signals and algorithms which were triggered by each transaction attempt.
Triggered signals
View of fraudulent attempts, events, block and pass requests
When looking at a given inquiry the first thing you will see are the signals which were triggered. Signals, in short, are notifications about abnormal situations which may be indicators of a higher probability of fraud. For example, you can see that clipboard was used on sensitive fields or incognito mode was detected. There are more than 100 of them and the list is growing.
Inquiries
List of user’s actions that trigger Nethone’s recommendation
Different symbols represent different inquiries within the same activity session of the user. For example, you can check what card was used and find out that it was different for both inquiries.
Map
Interactive display of user’s activities and geolocalisation
The map view gives you in a quick glance all the geographic information you need about a given transaction attempt. Where did they buy from? What route did they buy? Where is the card from?
Connection Graph
Analyze the web of relations in your merchant ecosystem
We are particularly proud of what we call the connection graph which shows the links between different profilings. All the nodes presented on the graph are related to each other by some feature. As you can notice these two profilings are connected by the same email address, user, IP address and cookie. This will put single profilings in context for you. You can check if the other profiling was detected as fraudulent or not and see how complex the whole network is.
Customisation
Preference selection for a specific client
You can customise your view by selecting which features you want to track and arrange them according to your personal preference. You may choose from quite a few widgets, including i.e. signals summary, card data or related profilings. We add new ones all the time!